Example: API Metrics with Prometheus and Grafana

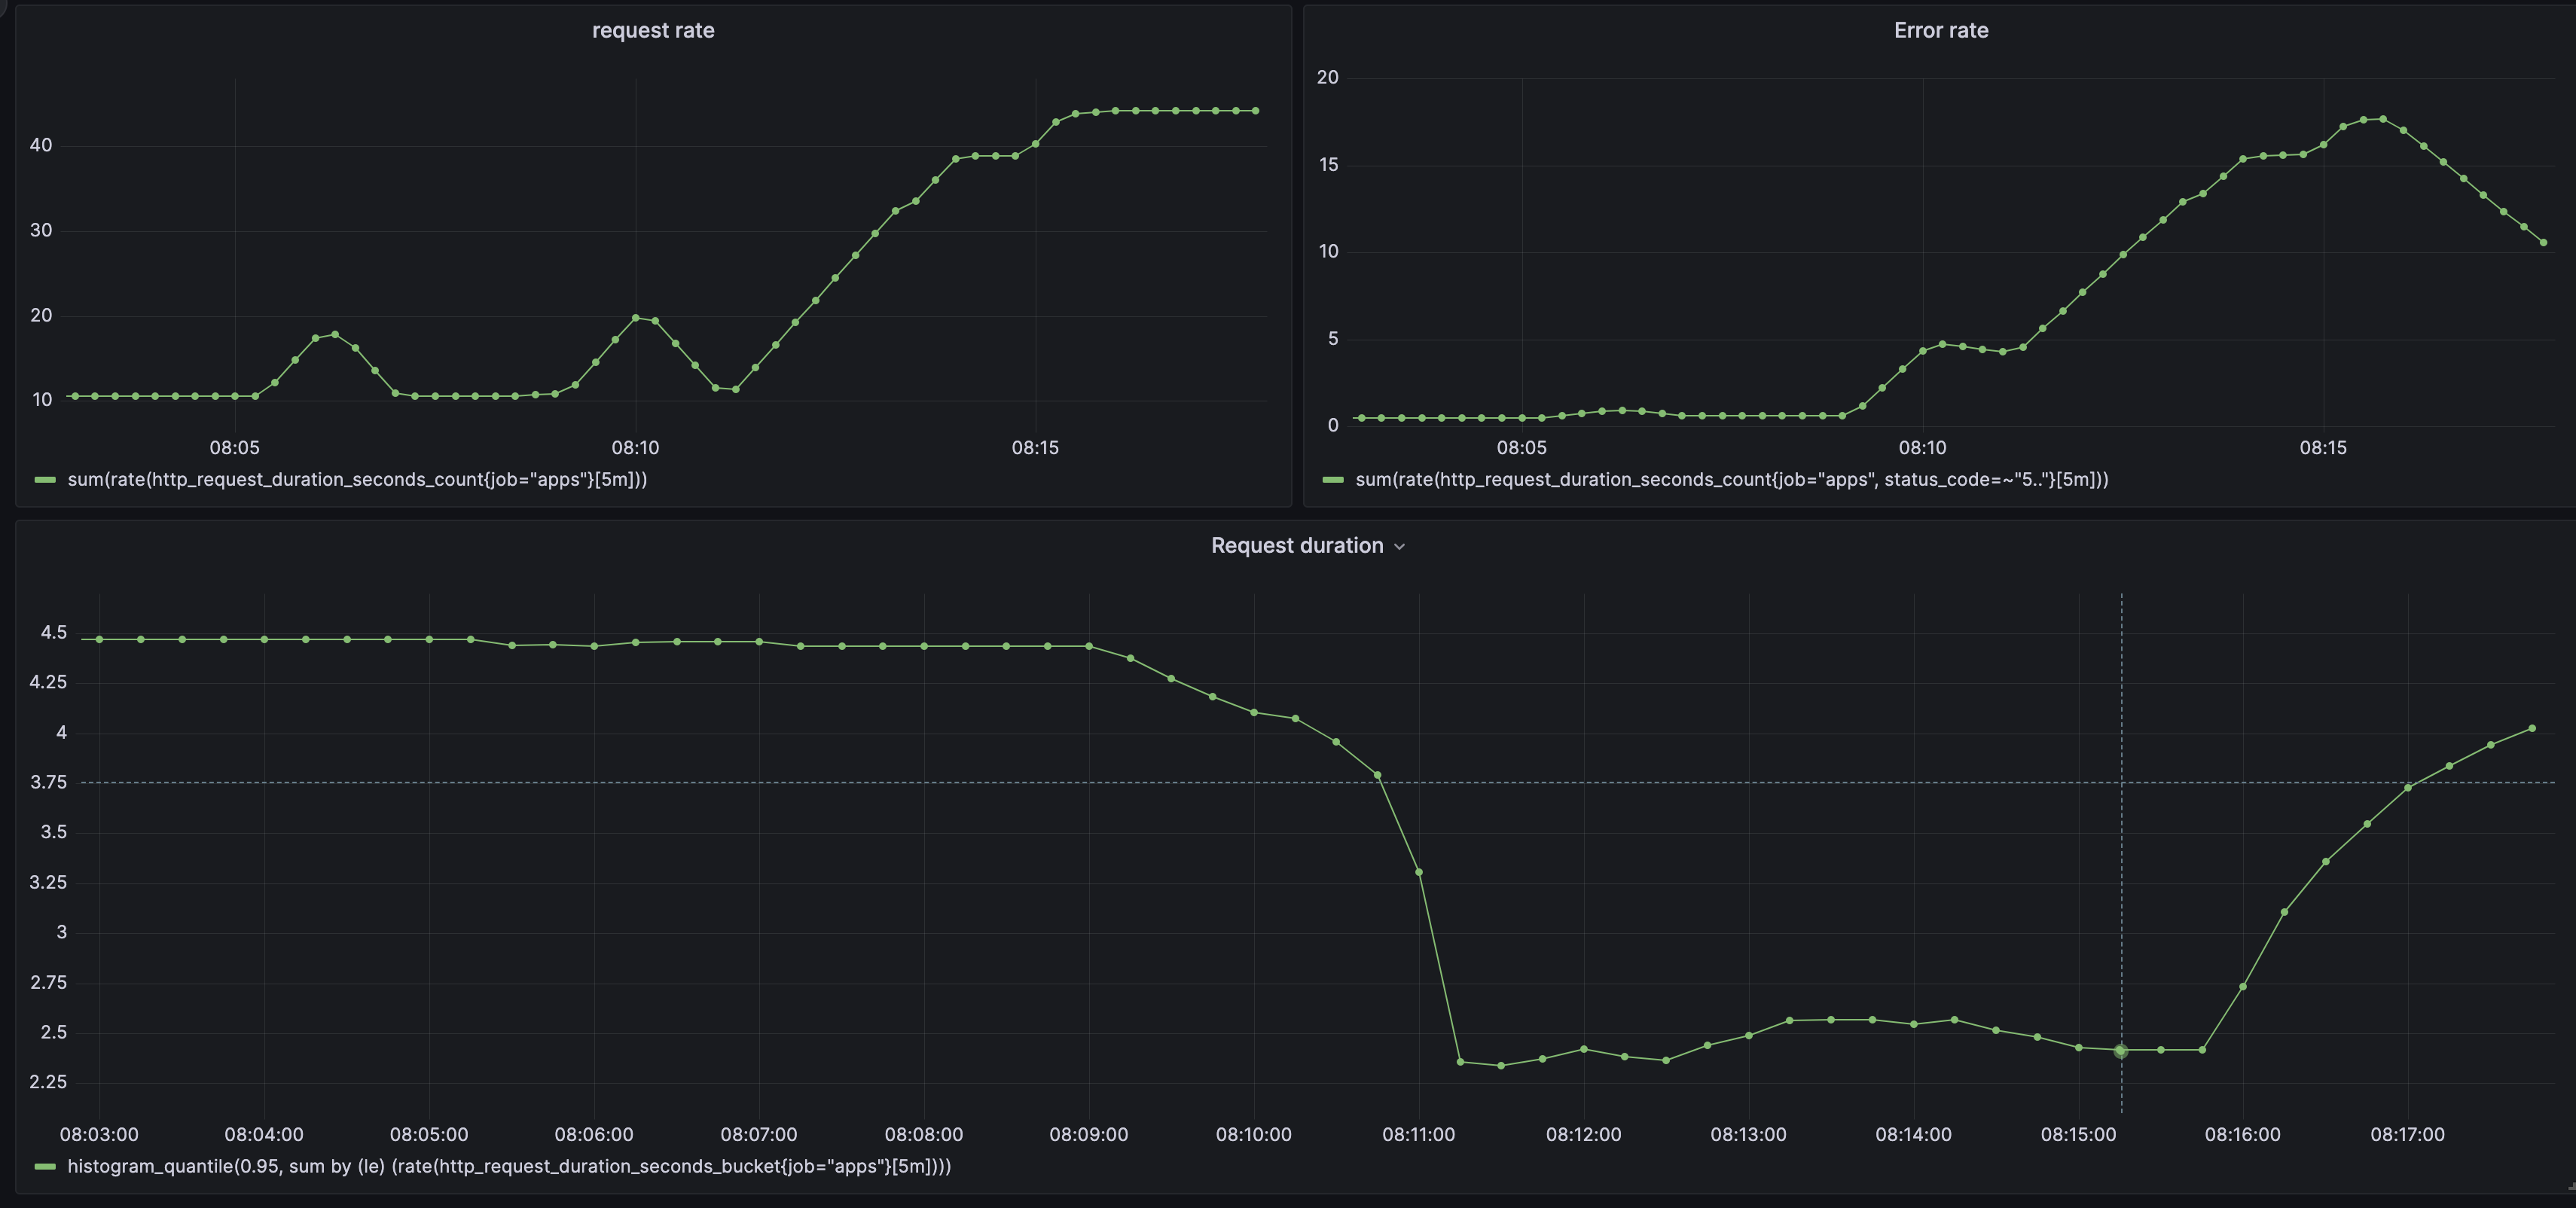
This post is a follow-up to the previous posts on designing metrics for event-driven systems. This humble post is a practical example of how to implement the metrics API and how to use it to create a dashboard in Grafana. I’m not using Kubernetes but Docker Compose; the concepts are the same. The reason is simplicity. The code is available on this GitHub repository. The Scenario The setup comprises two API services(app and beta) and a database(postgres)....

March 28, 2023 · 7 min · Robert Nemet

How to Design Metrics With Prometheus Metric Types: the USE Method

This is the third part of a series about designing metrics for event-driven systems. You can check the first part and the second part of this series before proceeding. While I discussed the general principles of designing metrics in the first part, I explained Prometheus metric types in the second part. I applied them as the RED method in the second part. In this article, I’ll explain the USE method with Prometheus....

March 20, 2023 · 5 min · Robert Nemet

How to Design Metrics With Prometheus Metric Types

This is the second part of a series about designing metrics for event-driven systems. You can check the first part of this series. Prometheus is open source system for monitoring and alerting. It is a part of CNCF (Cloud Native Computing Foundation) and it is one of the most popular monitoring systems. You can say it is a de facto standard for monitoring in Kubernetes. To design metrics with Prometheus, you need to understand its metric types....

March 8, 2023 · 6 min · Robert Nemet