
This post is a follow-up to the previous posts on designing metrics for event-driven systems. This humble post is a practical example of how to implement the metrics API and how to use it to create a dashboard in Grafana. I’m not using Kubernetes but Docker Compose; the concepts are the same. The reason is simplicity.
The code is available on this GitHub repository.
The Scenario
The setup comprises two API services(app and beta) and a database(postgres). Liquibase creates the database schema.
API services are two instances of the same service. They connect to the same database.
They are calling each other via HTTP calls, like ping-pong. Then there is an echo endpoint that returns the request body and a counter endpoint that counts
the number of calls to the endpoint. The counter is stored in the database. Metrics are exposed on the /metrics endpoint.
Metrics are collected by Prometheus and displayed in Grafana.
In addition, a vegeta service sends requests to API services, like load testing.
The code is available on the same repository. It is done in Go. The code is not the focus of this post, but I will show some snippets to give you an idea of how it is implemented.
Main
The main function is simple. It reads a configuration, creates a new router, registers the endpoints, starts endless calls to the other service, and starts the server. I’m using Chi router, but you can use any other router.
Endpoints
The /ping endpoint acts as an echo endpoint. It returns the request body when called and when it returns a response. It is configured to return 500
randomly, to simulate errors and random delays, to simulate slow responses.
When it is called, the /echo endpoint returns the request body. It is configured to return 500 randomly, to simulate errors but not delays.
The /counter endpoint returns the number of calls to the endpoint.
The /metrics endpoint returns the metrics in Prometheus format. It is implemented using Prometheus Go client.
Metrics and Middleware
The metrics are implemented using the Prometheus Go client library. The metrics are collected in the middleware. The middleware is registered in the main function. The middleware is called for every request. It collects the metrics and passes the request to the next handler.
 duration = prometheus.NewHistogramVec(prometheus.HistogramOpts{
  Name: "http_request_duration_seconds",
 }, []string{"status_code", "method", "path"})

 concurentRequests = prometheus.NewGauge(prometheus.GaugeOpts{
  Name: "http_concurrent_requests",
 })
I registered two metrics, http_request_duration_seconds and http_concurrent_requests.
The first one is a histogram that collects the duration of the request. Buckets are defined by default. It is okay, for example, but you should consider the buckets that make sense for your application. The labels are status_code, method, and path. The status_code is the HTTP status code,
method is the HTTP method, and path is the endpoint’s path.
The second one is a gauge that collects the number of concurrent requests.
func MetricsMiddleware(next http.Handler) http.Handler {
    return http.HandlerFunc(func(w http.ResponseWriter, r *http.Request) {
        concurentRequests.Inc()
        start := time.Now()
        wrapped := &wrapresponsewriter{ResponseWriter: w, statusCode: 200}
        next.ServeHTTP(wrapped, r)
        concurentRequests.Dec()
        duration.WithLabelValues(strconv.Itoa(wrapped.statusCode), r.Method, r.URL.Path).Observe(time.Since(start).Seconds())
    })
}
The middleware is simple. It increments the http_concurrent_requests gauge, starts the timer, calls the next handler, and decrements the gauge.
When the next handler returns, it collects the request duration and status code. The status code is captured using the wrapresponsewriter
wrapper.
I’m adding the label status_code to the metrics, so I can filter the metrics by status code.
Starting Services
To start the services you’ll need Git, Docker/Docker Compose, Go, some terminal, text editor and a browser. Get and install them if you don’t have them.
After you clone the repository, you can start the services using the following command in the terminal:
make start_observer
It will build the application, build docker images and start the services in the required order. It will also start the vegeta service that sends requests
to the API services. It will stop after a few minutes.
At the initial start, it will take some time to download all required images and build the docker images for the app. It will take some time, but it will be faster on subsequent starts.
If you open a browser and go to http://localhost:3000, you’ll see the Grafana dashboard. You can log in using admin as username
and grafana as password. If you browse dashboards, you’ll see available dashboards.
If you go to http://localhost:9090, you’ll see the Prometheus dashboard. No login is required.
The Dashboards
When you open Grafana and browse dashboards, you’ll see the following dashboards:
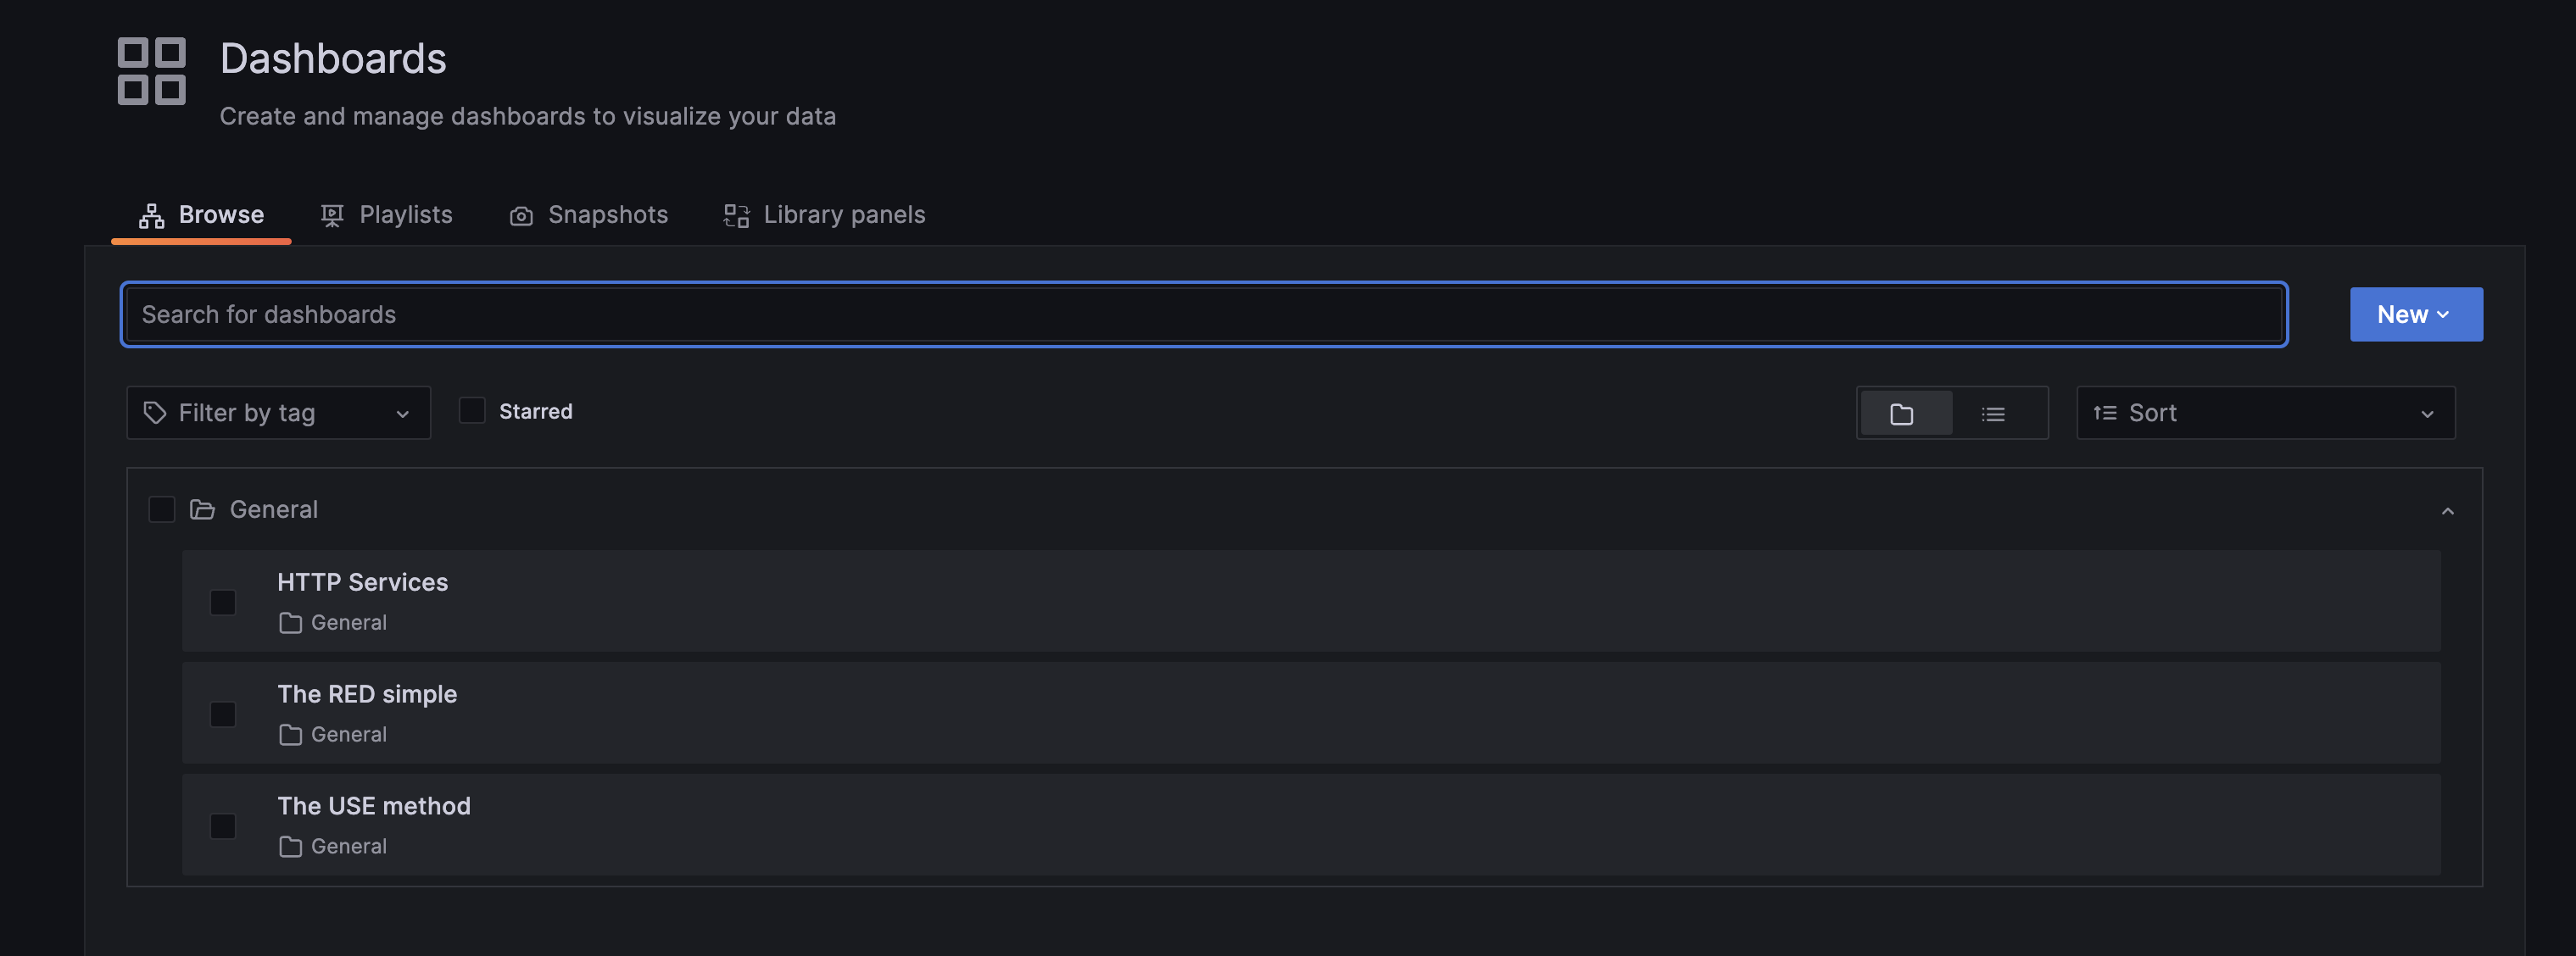
The one with the name HTTP Services is one that we are interested in. It is a dashboard that shows the metrics for the API services. You can access this by opening
the Dasboars menu and selecting Browse on the left side.
It is a simple dashboard created using the RED method. It shows the selected service’s request rate, error rate, and duration. It also shows the the number of concurrent requests for the service.
At the bottom, there is an overview of all available services. I added it because I need an overview of all services in one place. As well I can focus on a particular service and see the details by selecting it from the dropdown on the top left.
Creating the Dashboard
To create the dashboard, you need to open Dashboards menu and Then select + New Dashboard on the left. A new empty dashboard will be created. Now you
can start adding panels and rows.
You use rows to group panels. The panels are the actual visualizations. You can add rows and panels by clicking on the + icon on the top right side.
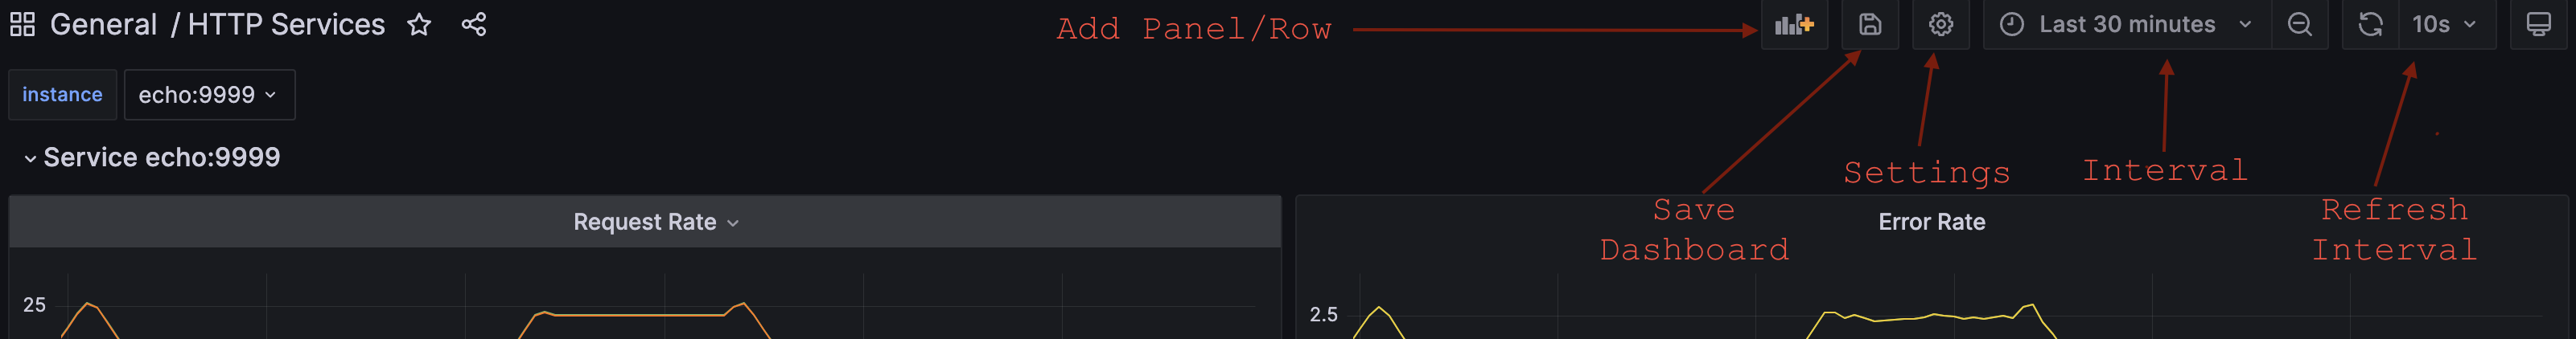
When satisfied with the dashboard, you can save it by clicking the Save button on the top right.
Adding Global Variables
Global variables are set on the dashboard level. They are available for all panels on the dashboard. You can add global variables by opening dashboard
settings and selecting Variables tab. You can add a new variable by clicking the New variable button on the top right.
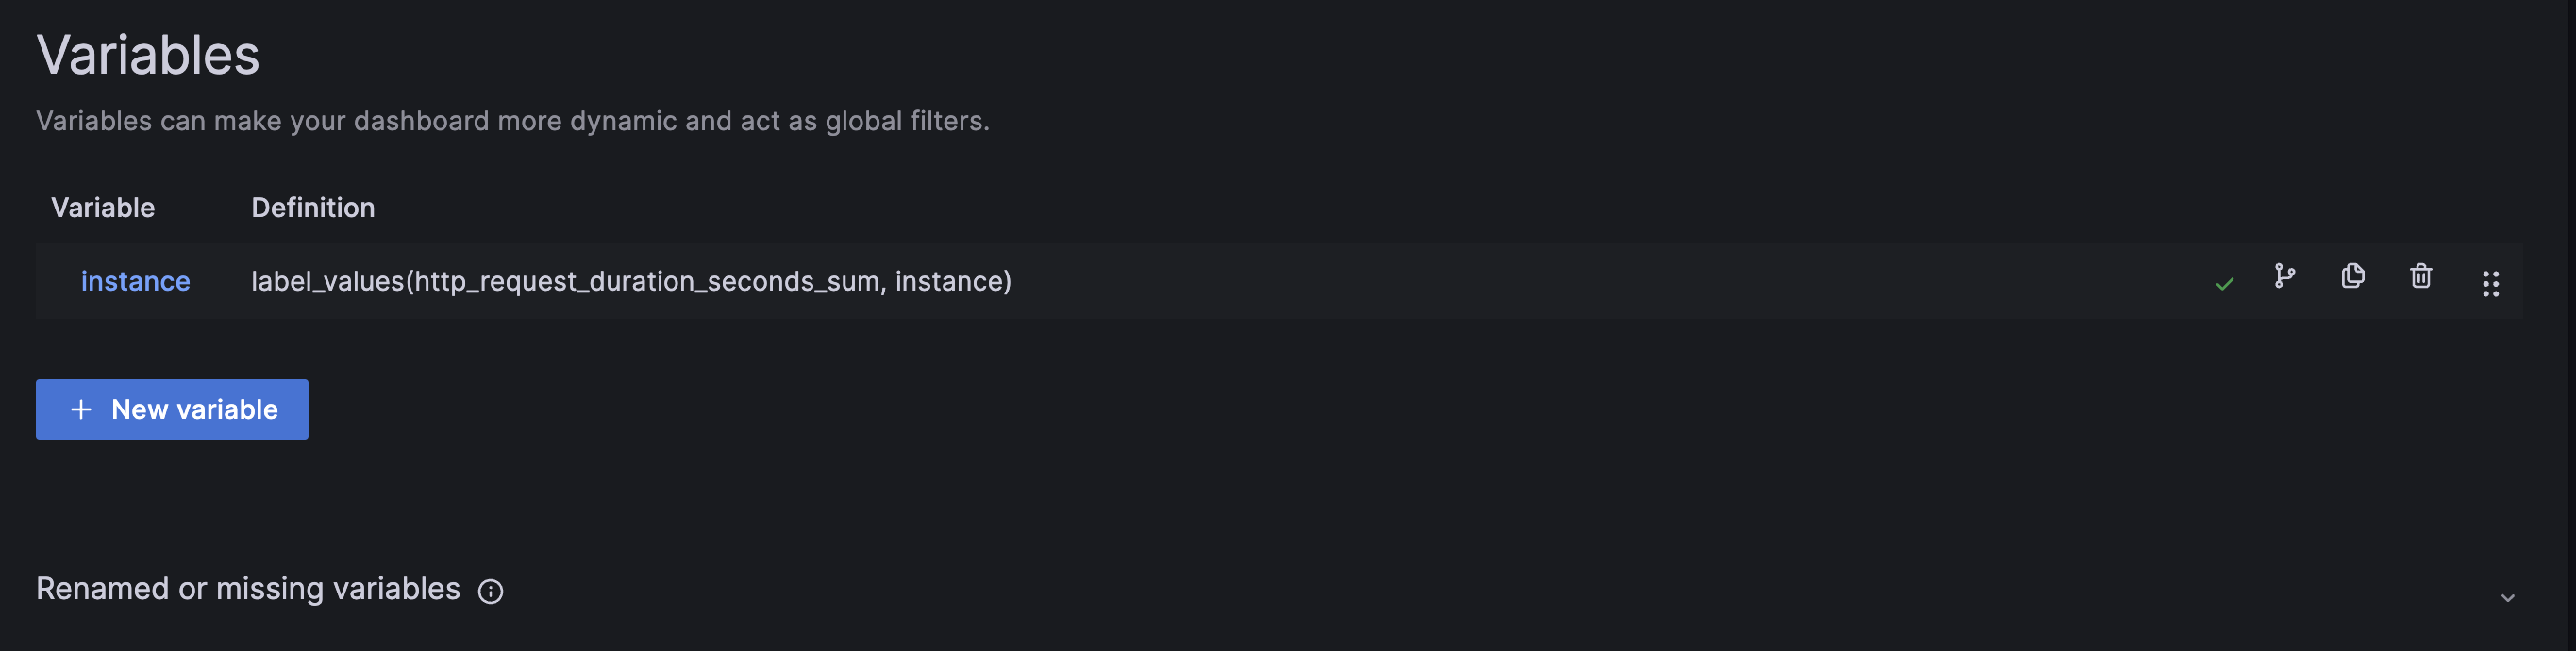
Here as well you can see the state of all variables. Some can be invalid(metric name changed for example) or not used. You can delete them too. Variables can hold one or more values. When getting values for variables from Prometheus, you want label values. To get them to use the following query:
label_values(<metric_name>, <label_name>)
Like this:
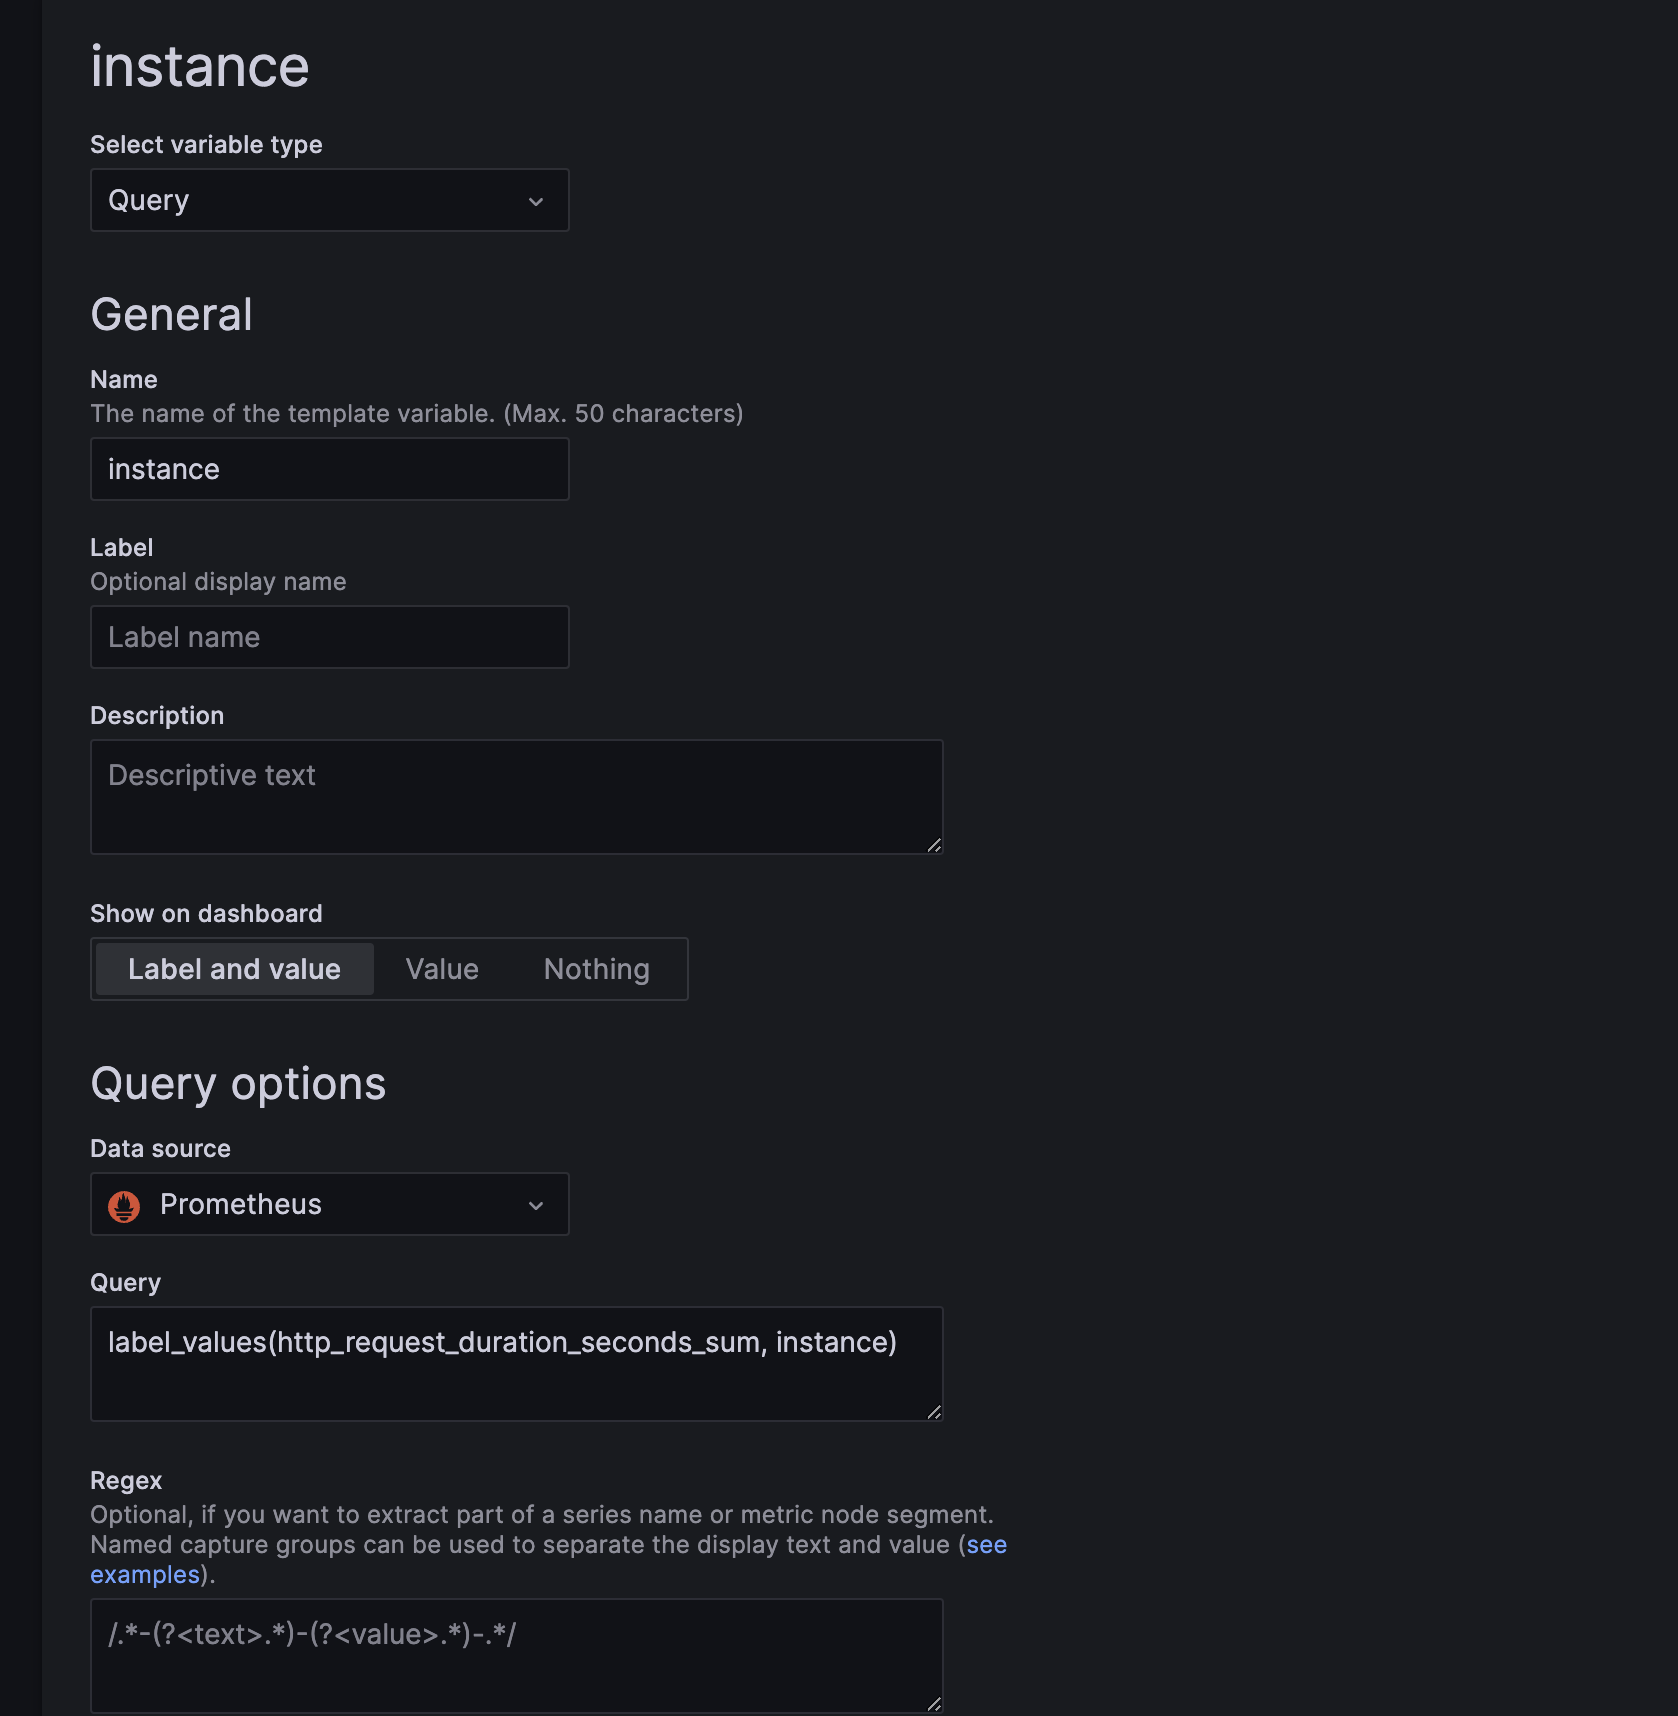
Add $ before the variable name to use the panel variable. Like this:
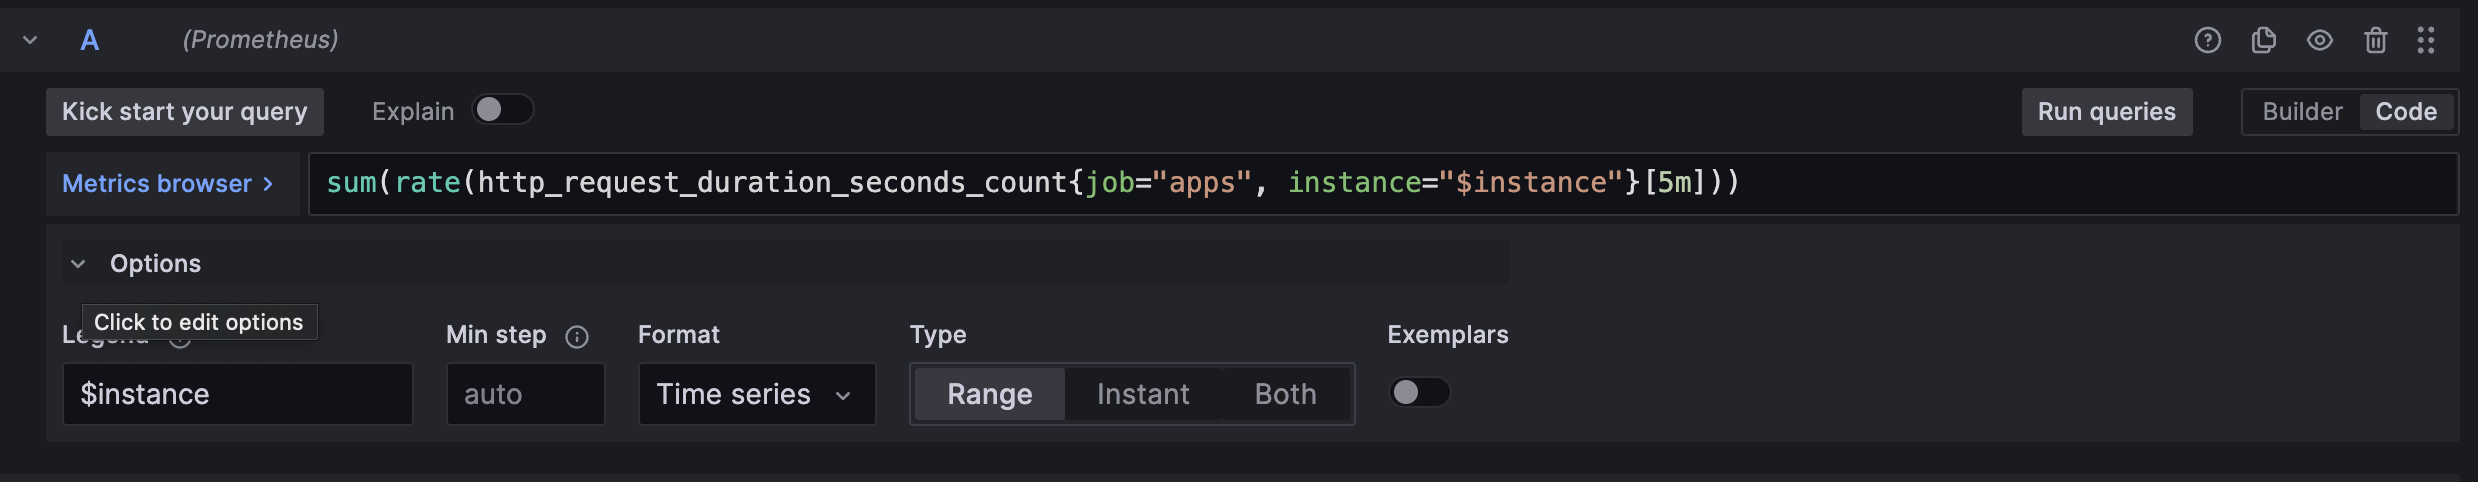
Notice that I’m using the variable in the Legend field and in the expression.
After Adding Variables and the first Panel
Now, continue. Add panels to visualize your metrics. Use Rows to group panels. Use copy/paste to duplicate panels/rows. In my setup, dashboards are
provisioned from files. Saving them from the UI will not work. You need to save them to files. You can find the files in the grafana/source/dashboards directory.
But if you make a new dashboard from scratch, you can save it from the UI.
If you make changes to any application and need to rebuild it, do it like this:
make restart COMPOSE_FILE=compose-extended.yml APP=<service name>
What is Next?
You can create your dashboards. Try to make them parameterized. That way you can use the same dashboard for multiple services. Add general overview panels to show metrics for all services. You can also add more metrics, like the number of requests in flight, the number of requests in a queue, etc.
I did not add any memory and CPU metrics. Since I’m running the services in Docker Compose on a single machine. There is no limit on the resources that can be used. But docker metrics are available. You can add them to the dashboard. Try playing with Grafana and Prometheus.
If you have any questions, feel free to ask them in the comments.
I suggest redoing this example with the local Kubernetes cluster. Let me know if you are interested in that.
Enjoy!