I set the stage for learning eBPF. As mentioned in the previous post, eBPF is a technology that allows us to run code in the kernel. This is a compelling technology, but it comes with a few limitations. One of them is that we can’t use the standard output to print messages. At least not directly. Let’s explore how we can do this.
Why can’t I use the standard input/output?
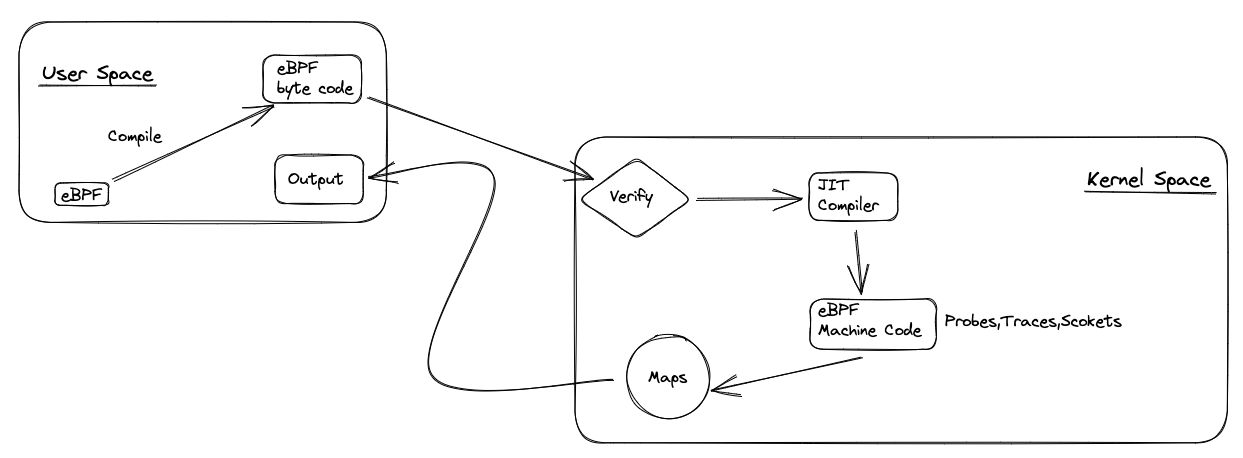
Let’s look at this picture 
The eBPF programs are executed in the kernel. The kernel is the core of the operating system. Other processes exist there that ensure the smooth operation of the system. To make this possible, the kernel is running in the privileged mode.
Programs run by the user are executed in the user space. The user space is running in the unprivileged mode. When the user space program wants to communicate with the kernel, it needs to use the system calls. The system calls are the interface between the user space and the kernel. The system calls are the only way to communicate with the kernel. The kernel is not exposing any other interface to the user space.
Because of that, we need to have the correct permissions for injecting, executing, and reading the eBPF programs. You must already notice that when you are running the simple hello.py script, you need to have root permissions. The root permissions have enough privileges to communicate with the kernel. In this case, load the eBPF program in the kernel, attach it to the events stream, and execute it.
This is an answer to why we can’t use the standard output directly. The standard output is a user space concept. But we can communicate with eBPF programs using the system data structures and calls. They are designed to allow communication between the user space and the kernel, and other eBPF programs can use them to exchange data. Let’s scratch the surface of this topic.
Simple output(bpf_trace_printk)
Let’s look at this BCC example:
#!/usr/bin/python3
from bcc import BPF

program = r"""
#include <linux/sched.h>

int hello(void *ctx) {

    int pid = bpf_get_current_pid_tgid() >> 32;
    int uid = bpf_get_current_uid_gid() & 0xFFFFFFFF;
    char command[TASK_COMM_LEN];
    bpf_get_current_comm(command, sizeof(command));

    bpf_trace_printk("uid = %d, pid = %d, comm %s", uid, pid, command);

    return 0;
}
"""

b = BPF(text=program, cflags=["-Wno-macro-redefined"])
syscall = b.get_syscall_fnname("execve")
b.attach_kprobe(event=syscall, fn_name="hello")

b.trace_print()
This simple program prints the uid, pid, and the command name of the process executing the execve system call. I use:
- The bpf_get_current_pid_tgid function to get the pid(process id) of the process
- The bpf_get_current_uid_gid function to get the uid(user id) of the process
- The bpf_get_current_comm function to get the command name of the process
The bpf_trace_printk is a function that allows us to print messages from the
eBPF program. The messages are sent to the predefined pseudo-file on location /sys/kernel/debug/tracing/trace_pipe. So, bpf_trace_printk helper function sends my
messages to the trace_pipe file. The trace_pipe file is a special file that is used by the kernel to send messages to the user space. Then I can read them with the
trace_print() function or with the cat command.
In the above recording, you’ll notice whenever I execute the execve system call, the eBPF program prints the message on the top third of the screen. The messages are
in the trace_pipe file, too. Notice the middle part of the screen where cat /sys/kernel/debug/tracing/trace_pipe is executed. At the bottom, I run simple commands
like the regular user and root. Notice the difference in the messages. The messages that are printed by the root user have the uid 0. Also, notice that opening a new shell
session create several message output. There are many messages because several actions are done when opening a new shell.
While working bpf_trace_printk is easy, it has some limitations. For example, if you have multiple eBPF programs that are printing messages, all the messages will be
mixed in the trace_pipe file. It is hard to distinguish which message is coming from which program. Also, the trace_pipe file is a special file
designed for debugging purposes. It is not intended for production use. So, we must find a better way to communicate with the user space.
I find it helpful to use bpf_trace_printk for debugging purposes. It is a quick way to print messages from the eBPF program.
Maps
Maps as data structures are used to store data. When it comes to eBPF, maps are data structures that are used to exchange data between the user space and the kernel.
Also, maps are used to exchange data between eBPF programs. In general, maps are key-value stores. But still, different types of maps exist. The reason is that
some of them are optimized for different use cases. At the same time, other eBPF maps hold information about specific object types. For example, there is the BPF_MAP_TYPE_QUEUE map, which is optimized as a FIFO(first in, first out) queue, and BPF_MAP_TYPE_STACK which provides a LIFO(last in, first out) stack. Check linux docs
on them for more information.
Or maps used to hold information about network devices.
Let’s check this example:
#!/usr/bin/python3
from bcc import BPF
from time import sleep

program = r"""
struct data_t {
   u64 counter;
   int pid;
   char command[16];
};

BPF_HASH(counter_table, u64, struct data_t);

int hello(void *ctx) {
   struct data_t zero = {};
   struct data_t *val;


   u64 uid = bpf_get_current_uid_gid() & 0xFFFFFFFF;
   int pid = bpf_get_current_pid_tgid() >> 32;

   val = counter_table.lookup_or_try_init(&uid, &zero);
   if (val) {
      val->counter++;
      val->pid = pid;
      bpf_get_current_comm(&val->command, sizeof(val->command));
   }

   return 0;
}
"""

b = BPF(text=program, cflags=["-Wno-macro-redefined"])

syscall = b.get_syscall_fnname("execve")
b.attach_kprobe(event=syscall, fn_name="hello")


old_s = ""
while True:
   sleep(2)
   s = ""
   for k,v in b["counter_table"].items():
      s += f"ID {k.value}: cnt: {v.counter} pid: {v.pid} comm: {v.command}\t"
   if s != old_s:
      print(s)
   old_s = s
The above example is similar to the previous one. But this time, I’m using the map to store information about the processes. I use the BPF_HASH map to create the map
counter_table. I use the uid of the process for a key, and for value, I use the struct data_t structure. The struct data_t structure holds the counter for all
commands the user executed, pid, and the command name of the last process run by a user.
The hello function is attached to the execve system call. When the execve system call is executed, I check if the user is already in the map. If not, I add
the user to the map. Suppose the user is already in the map. In that case, I increment the counter and update the pid and the command name of the last process executed by the user.
Later, in Python script, I read the map and print the information about the users. I use the items() function to iterate over the map. The items() function returns
the key and value for each entry in the map. I use the value to get the struct data_t structure. Then, I print the information about the user.
Ring buffers
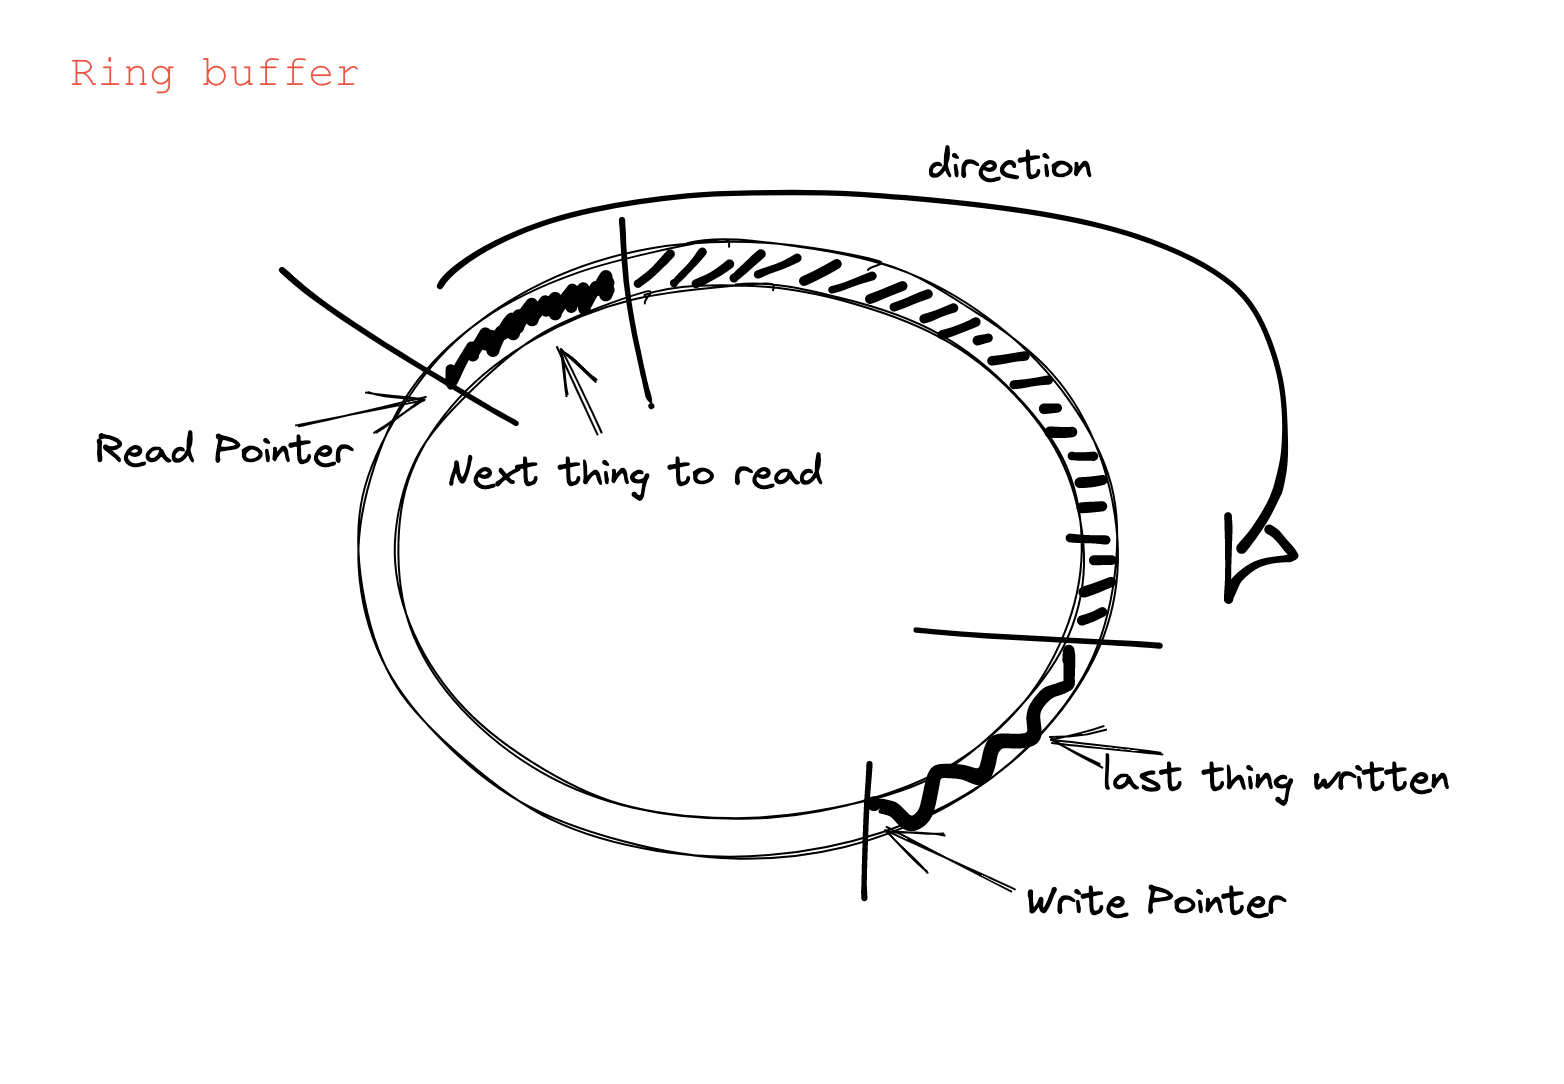
Like maps, ring buffers are data structures that exchange data between the user space and the kernel. Look at the picture:

In short, ring buffers are circular buffers. They have two pointers: one for reading and one for writing. The pointers are moving in the same direction. If the read pointer catches the write pointer, the buffer is empty. If the write pointer catches the read pointer, the buffer is full. Then, the next element to be written will be dropped.
There are two types of ring buffers BPF_PERF_OUTPUT and
BPF_RINGBUF_OUTPUT. The BPF_RINGBUF_OUTPUT is more advanced than BPF_PERF_OUTPUT.
I will not go into the details about the differences between them please check the docs.
Here is a familiar example:
#!/usr/bin/python3
from bcc import BPF

program = r"""
BPF_PERF_OUTPUT(counter_table);

struct data_t {
   int pid;
   int uid;
   char command[16];
};


int hello(void *ctx) {
   struct data_t data = {};

   data.pid = bpf_get_current_pid_tgid() >> 32;
   data.uid = bpf_get_current_uid_gid() & 0xFFFFFFFF;

   bpf_get_current_comm(&data.command, sizeof(data.command));

   counter_table.perf_submit(ctx, &data, sizeof(data));

   return 0;
}
"""

b = BPF(text=program, cflags=["-Wno-macro-redefined"])
syscall = b.get_syscall_fnname("execve")
b.attach_kprobe(event=syscall, fn_name="hello")

def print_event(cpu, data, size):
   data = b["counter_table"].event(data)
   print(f"{data.pid} {data.uid} {data.command.decode()}")

b["counter_table"].open_perf_buffer(print_event)
while True:
   b.perf_buffer_poll()
This time difference is when reading from the ring buffer, I’m passing the callback print_event. The print_event callback is called when the data is available in
the ring buffer. It has to have three arguments: cpu, data, and size. The cpu argument is the cpu number on which the event was generated. The data argument
is the data that is read from the ring buffer. The size argument is the size of the data read from the ring buffer.
Summary
So, even if eBPF has no direct access to the standard output, there are ways to exchange data between the user space and the kernel. Plus, given data structures, maps are usually optimized for the specific use case. That should make your life easier.
